
40+ Key Female vs Male Education Statistics in the UK
 Tus Media
Male vs female education statistics in the UK have long been a subject of analysis, with varying trends emerging across different educational stages. The gender gap appears in various forms, from the number of male and female students enrolled in different phases of education to their academic performance and even the gender composition of the workforce.

Key Takeaways
- Pupil Gender Distribution: In the 2023/24 academic year, there were 5.16 million female pupils and 5.38 million male pupils in UK schools. Males made up approximately 51.2% of the total pupil population, while females represented 48.8%. (Explore Education Statistics)
- Postgraduate Education: Female students outnumber male students in postgraduate education, with an 11.3% increase in female enrolments in postgraduate research from 2021/22 to 2022/23, reaching 64,370 females compared to 58,270 males. (HESA, 2024)
- Gender Gap in Higher Education: In 2022/23, 1.67 million females and 1.25 million males were enrolled in higher education (tertiary education) in the UK, showing higher female participation, particularly in postgraduate studies. HESA, 2024
- Teacher Workforce: 76% of UK teachers are female. Male teachers are more likely to be in secondary schools. (Explore Education Statistics)
- GCSE Participation: There were 3.1 million male participants and 3.08 million female participants in the 2024 GCSE exams, with gender parity overall. (JCQ)
- GCSE Performance: Female students generally outperform males in English Language and Literature, with higher pass rates, while males perform better in Mathematics at the top grade levels. (JCQ)
- A-Level Participation: Female participation in A-Level exams (479,482) exceeds male participation (407,032), with females particularly dominant in subjects like Psychology, English Literature, and Biology. (JCQ)
- A-Level Performance: Females outperformed males in almost all subjects, particularly in English Language, English Literature, and Psychology, but males had a slightly higher A*/A grade rate in Mathematics and Physics. (JCQ)
- Gender Gaps in Subject Choice: Females tend to favour languages, humanities, and social sciences, while males gravitate toward STEM subjects like Mathematics, Physics, and Computer Science. (JCQ)
Female vs Male Education Statistics in the UK
This article explores gender disparities across different educational stages, including primary school, secondary school, and university education, focusing on participation rates, academic performance, and subject choices. We will also look at the representation of both genders in teaching roles.
Content Table
Gender Disparities in UK Education: Male vs Female Education Statistics
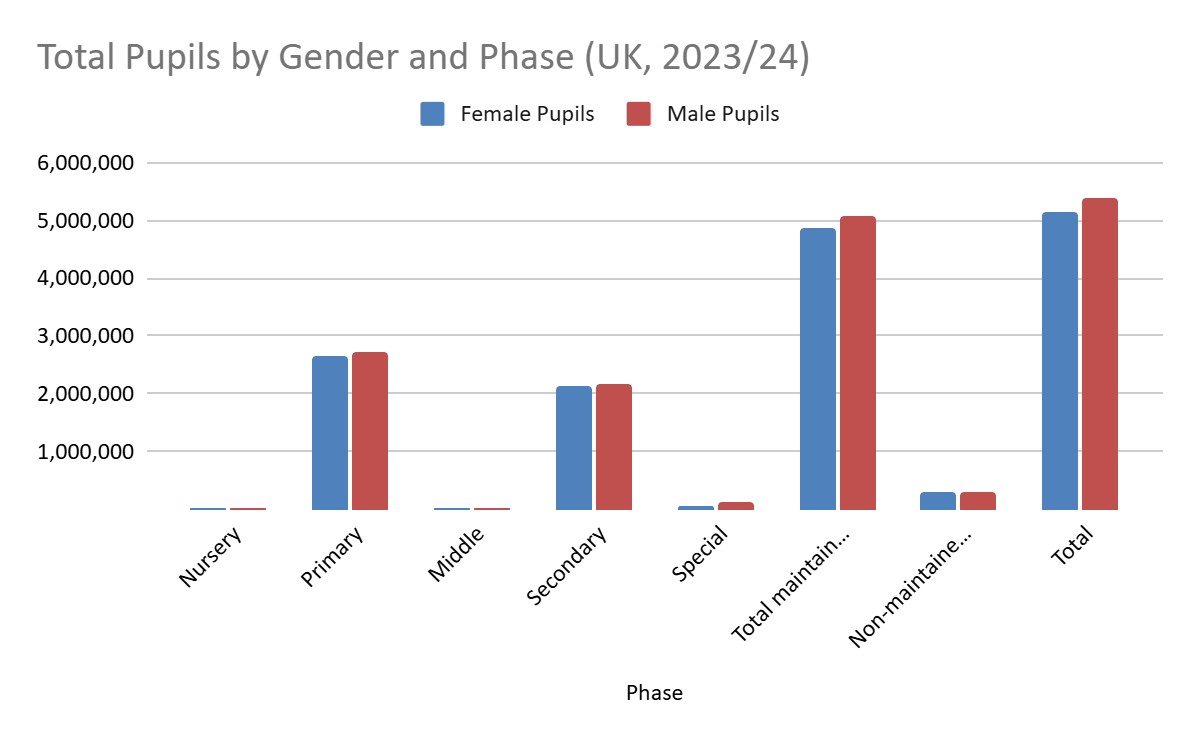
Looking at the total number of pupils in the UK in 2023/24, we can see gender disparities across different educational phases. While there are more boys in primary school compared to girls and more female pupils in secondary education, the most significant gender difference is seen in special education.
What are the current gender statistics in UK education?
Here’s a breakdown of the total number of pupils by gender and phase:
|
Phase |
Female Pupils |
Male Pupils |
|---|---|---|
|
Nursery |
20,427 |
22,530 |
|
Primary School |
2,638,641 |
2,736,266 |
|
Middle |
14,603 |
14,356 |
|
Secondary |
2,134,164 |
2,160,816 |
|
Special |
53,950 |
137,046 |
|
Total Maintained |
4,861,785 |
5,071,014 |
|
Non-Maintained Mainstream |
295,180 |
312,552 |
|
Total |
5,156,965 |
5,383,566 |
Source: Explore Education Statistics for the UK (UK Education and Training Statistics, 2023/24).
- There are 2,103 more male pupils than female pupils in the nursery phase, with males making up around 52.4% and females 47.6%.
- Males outnumber females by 97,625 pupils, making up about 50.9% of the primary school population compared to 49.1% for females.
- The gender distribution is almost equal in middle schools, with a very slight difference of 247 more male pupils (around 50.3% male vs 49.7% female).
- Males have a slightly higher representation, with 26,652 more male pupils, making up about 50.3% of the secondary education population compared to 49.7% for females.
- Males dominate the special education phase with 83,096 more male pupils, representing 71.8% of the special education population compared to 28.2% for females.
- Across all phases, males outnumber females by 226,601 pupils, making up 51.2% of the total pupil population, while females make up 48.8%.
GCSE and A-Level Participation and Performance by Gender
The gender gap in GCSE and A-Level participation is relatively small, with only slight differences in the number of participants by gender. Below are the total participation numbers for both GCSE and A-Level in 2024.
|
Education Level |
Male Participants |
Female Participants |
|---|---|---|
|
GCSE |
3,109,294 |
3,077,585 |
|
A-Level |
407,032 |
479,482 |
Source: JCQ (2024)
- At GCSEs male participants slightly outnumber female participants, with 31,709 more males. Males make up approximately 50.3% of the total, while females make up 49.7%.
- At A-Levels, females significantly outnumber males, with 72,450 more female participants. Females account for 54.1% of the total A-Level participants, while males make up 45.9%.
GCSE Participation: Male vs Female Education Statistics in 2024
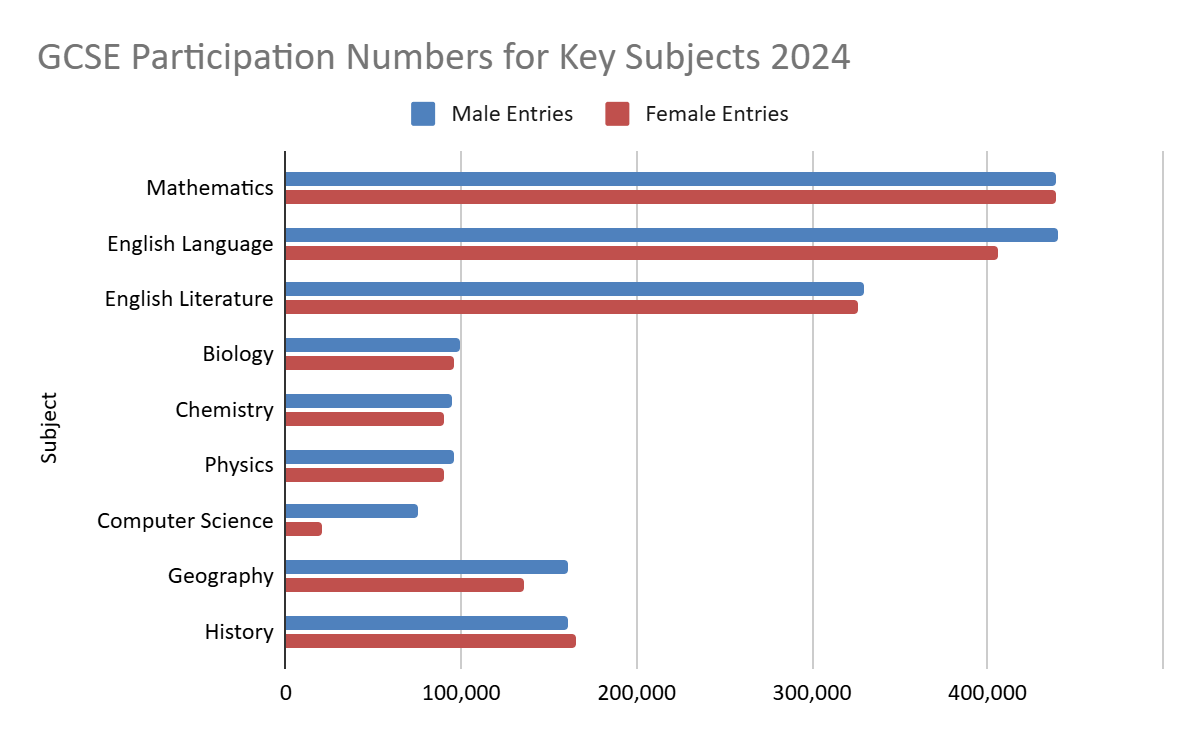
At the GCSE level, the proportion of female and male students varies across subjects. For instance, there is near-equal participation in subjects like Mathematics, but females dominate in English Language and Literature. Below is the table showing the number of participants by gender in key subjects in 2024:
|
Subject |
Male Entries |
Female Entries |
|---|---|---|
|
Mathematics |
438,937 |
439,228 |
|
English Language |
439,947 |
405,887 |
|
English Literature |
329,456 |
326,449 |
|
Biology |
98,839 |
96,095 |
|
Chemistry |
94,646 |
90,628 |
|
Physics |
95,351 |
89,684 |
|
Computer Science |
74,821 |
21,020 |
|
Geography |
161,392 |
136,019 |
|
History |
160,395 |
165,042 |
Source: JCQ (2024)
-
Mathematics:
-
The participation in Mathematics is nearly equal, with 438,937 male entries and 439,228 female entries, reflecting a near-balanced gender representation.
-
-
English Language and Literature:
-
English Language sees more male entries (439,947 vs. 405,887 females), but English Literature has a slight female majority (165,042 females vs. 160,395 males), indicating a stronger female preference for the subject.
-
-
STEM Subjects (Biology, Chemistry, Physics):
-
Males have a higher representation in Physics (95,351 males vs. 89,684 females) and Computer Science (74,821 males vs. 21,020 females), while the gap in Biology is narrower (98,839 males vs. 96,095 females).
-
-
Geography and History:
-
Geography has more male entries (161,392 males vs. 136,019 females), while History sees a female majority (165,042 females vs. 160,395 males).
-
GCSE Success Rates by Gender in 2024
The success rates in key subjects at the GCSE level show a distinct gender difference, particularly in subjects like English Language and English Literature, where females tend to outperform males. Below is the table displaying the success rates for male and female pupils across various grading brackets (A*/7, C/4, Pass Rate):
|
Subject |
Gender |
A/7 Grade (%)* |
C/4 Grade (%) |
Pass Rate (%) |
|---|---|---|---|---|
|
Mathematics |
Male |
18.00% |
60.20% |
97.20% |
|
Female |
15.80% |
58.90% |
97.30% |
|
|
English Language |
Male |
11.50% |
55.40% |
97.40% |
|
Female |
20.10% |
68.90% |
99.00% |
|
|
English Literature |
Male |
15.00% |
68.20% |
96.90% |
|
Female |
25.90% |
79.90% |
98.70% |
Source: JCQ (2024)
-
Mathematics:
-
Males slightly outperform females in the top grades (A*/7), but females have a slightly higher pass rate, indicating a more consistent performance across the board.
-
-
English Language and Literature:
-
Females outperform males significantly in both English Language and English Literature, especially in the A*/7 grades, with females achieving 20.10% A*/7 in English Language compared to 11.50% for males.
-

A-Level Participation: Male vs Female Education Statistics in 2024
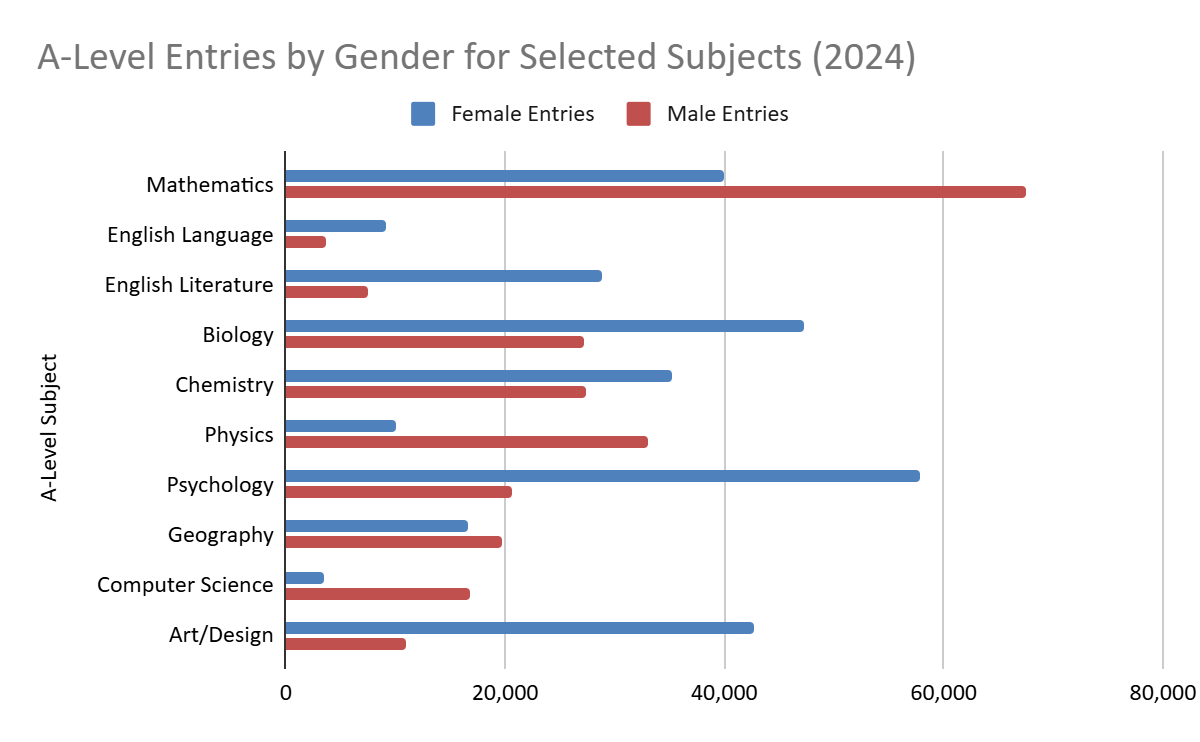
At A-Levels, gender differences in participation are also noticeable, particularly in subjects like Psychology, English Literature, and Biology, where females significantly outnumber males. Conversely, subjects like Mathematics, Physics, and Computer Science have higher male participation.
Here is the table showing A-Level entries by gender for key subjects in 2024:
|
A-Level Subject |
Female Entries |
Male Entries |
Female Share (%) |
|---|---|---|---|
|
Mathematics |
39,943 |
67,484 |
37.20% |
|
English Language |
9,159 |
3,733 |
70.00% |
|
English Literature |
28,808 |
7,504 |
77.00% |
|
Biology |
47,196 |
27,171 |
63.50% |
|
Chemistry |
35,188 |
27,395 |
56.30% |
|
Physics |
10,026 |
33,088 |
23.30% |
|
Psychology |
57,883 |
20,673 |
73.80% |
|
Geography |
16,666 |
19,648 |
46.90% |
|
Computer Science |
3,556 |
16,814 |
17.50% |
|
Art/Design |
42,774 |
10,894 |
79.50% |
Source: JCQ (2024)
- Subjects Dominated by Males:
-
-
Mathematics: Males outnumber females by 27,541 participants, with 67,484 males (63.3%) and 39,943 females (37.2%).
-
Physics: Males dominate with 33,088 male participants (76.7%) compared to 10,026 females (23.3%).
-
Geography: Males outnumber females with 19,648 males (53.7%) and 16,666 females (46.9%).
-
Computer Science: Males significantly outnumber females with 16,814 males (82.9%) and 3,556 females (17.5%).
-
-
Subjects Dominated by Females:
-
English Language: Females dominate with 9,159 females (70%) compared to 3,733 males (30%).
-
English Literature: Females significantly outnumber males with 28,808 females (77%) and 7,504 males (23%).
-
Biology: Females lead with 47,196 females (63.5%) and 27,171 males (36.5%).
-
Chemistry: Females outnumber males with 35,188 females (56.3%) and 27,395 males (43.7%).
-
Psychology: Females significantly outnumber males with 57,883 females (73.8%) compared to 20,673 males (26.2%).
-
Art/Design: Females dominate with 42,774 females (79.5%) compared to 10,894 males (20.5%).
-
A-Level Success Rates by Gender
The A-Level success rates highlight close gender-based differences, with females having slightly higher pass rates in English Language, Literature, and Mathematics.
|
Subject |
Gender |
Pass Rate (%) |
|---|---|---|
|
Mathematics |
Male |
95.80% |
|
Female |
96.50% |
|
|
English Language |
Male |
98.40% |
|
Female |
99.20% |
|
|
English Literature |
Male |
98.80% |
|
Female |
99.30% |
Source: JCQ (2024)
-
Mathematics:
-
Males have a slightly lower pass rate (95.80%) than females (96.50%).
-
-
English Language:
-
Females have a higher pass rate (99.20%) than males (98.40%).
-
-
English Literature:
-
Females again outperform males, with 99.30% pass rate compared to 98.80% for males.
-
Higher Education: The Male vs Female Education Statistics in Postgraduate and Undergraduate Studies
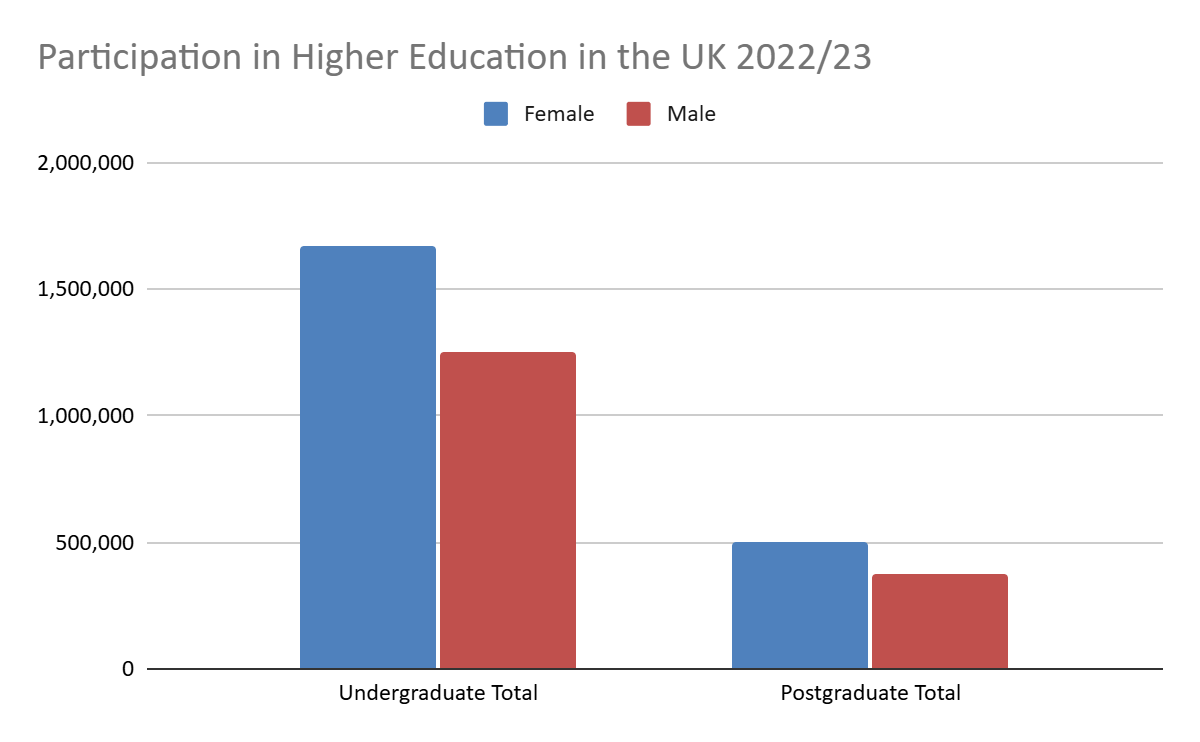
The gender gap in higher education continues to favour females. In 2022/23, there were 1.67 million girls compared to 1.25 million male pupils enrolled in higher education in the UK, maintaining the trend of higher female participation, particularly in postgraduate studies.
These trends in participation contribute to differing educational outcomes across genders, with females generally achieving higher rates of success in higher education.
How does the gender gap affect further and higher education?
-
Postgraduate Enrolments: Female enrolments in postgraduate research grew by 11.3% from 2021/22 to 2022/23, reaching 64,370 females compared to 58,270 males. Meanwhile, female enrolments in postgraduate taught courses rose by 6.7%, while male enrolments grew by 7.7%.
At the postgraduate level, female enrolments have seen significant growth, with higher education providers offering various initiatives to support this increase, particularly in research-focused courses.
-
Undergraduate Enrolments: At the undergraduate level, females made up 1.16 million of the total enrolments in 2022/23, while males accounted for 878,310. Though the gap is narrower, females continue to lead in undergraduate enrolments, reinforcing the trend of higher female participation in higher education.
Here’s a detailed breakdown of the enrolments by level of study:
|
Female 2021/22 |
Female 2022/23 |
Male 2021/22 |
Male 2022/23 |
|
|
Postgraduate |
|
|||
|
Doctorate research |
53,220 |
60,180 |
50,870 |
54,590 |
|
Other postgraduate research |
4,385 |
4,110 |
3,865 |
3,625 |
|
Institutional credit at postgraduate research |
215 |
80 |
160 |
55 |
|
Total postgraduate research |
57,820 |
64,370 |
54,895 |
58,270 |
|
Master's taught |
307,735 |
341,410 |
249,020 |
275,160 |
|
Postgraduate Certificate in Education |
19,795 |
15,430 |
8,140 |
6,270 |
|
Other postgraduate taught |
57,405 |
56,605 |
25,845 |
24,870 |
|
Institutional credit at postgraduate taught |
27,330 |
26,490 |
9,720 |
8,925 |
|
Total postgraduate taught |
412,270 |
439,930 |
292,725 |
315,230 |
|
Total postgraduate |
470,095 |
504,300 |
347,625 |
373,500 |
|
Undergraduate |
|
|||
|
First degree |
1,063,145 |
1,063,450 |
816,930 |
815,970 |
|
Foundation degree |
19,580 |
18,045 |
9,170 |
8,635 |
|
HNC/HND |
7,960 |
8,040 |
10,075 |
10,220 |
|
Professional Graduate Certificate in Education |
765 |
685 |
355 |
310 |
|
Other undergraduate |
39,775 |
41,115 |
23,640 |
27,375 |
|
Institutional credit at undergraduate |
28,245 |
32,970 |
13,090 |
15,805 |
|
Total other undergraduate |
96,325 |
100,850 |
56,325 |
62,345 |
|
Total undergraduate |
1,159,470 |
1,164,300 |
873,260 |
878,310 |
|
Total |
1,629,565 |
1,668,600 |
1,220,880 |
1,251,815 |
Source: HESA, 2024.
Key Trends in Tertiary Education
-
Postgraduate Research:
-
Females continue to outnumber males, with female enrolments rising by 11.3% compared to a 6.3% increase in male enrolments, indicating stronger growth in female participation at the research level.
-
-
Postgraduate Taught:
-
Female enrolments in Master’s courses rose by 6.6% from 307,735 in 2021/22 to 341,410 in 2022/23, further solidifying the trend of increased female representation in advanced postgraduate education.
-
-
Undergraduate Enrolments:
-
At the undergraduate level, females made up 57.1% of the total enrolments in 2022/23, continuing the trend of higher female participation in higher education.
-

Teacher Workforce Gender Representation
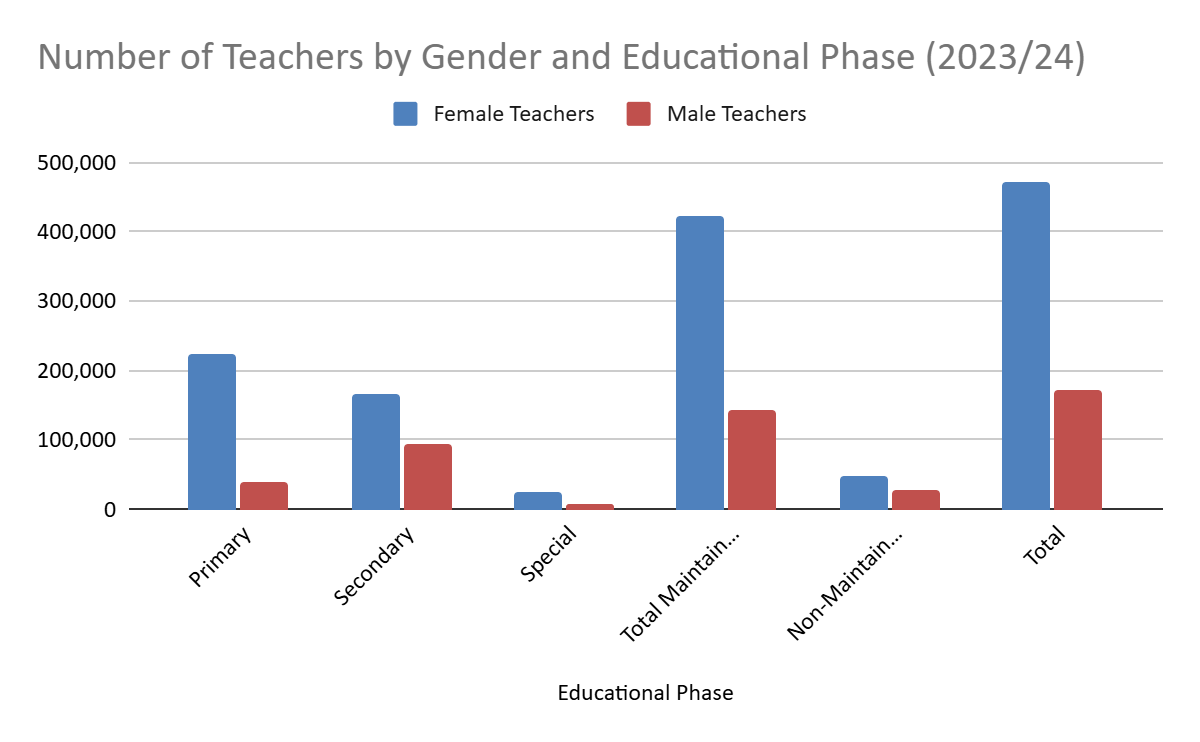
- 471,471 female teachers (about 76% of the total teaching workforce).
- 171,637 male teachers (about 24% of the total teaching workforce).
Is there a gender gap in teaching roles?
As for the teaching workforce, females make up the majority in all phases of education. In the context of workforce statistics, the development of these figures shows that 76% of teachers in the UK are female, but male teachers are more likely to work in secondary schools rather than in primary or nursery schools.
|
Educational Phase |
Female Teachers |
Male Teachers |
|---|---|---|
|
Nursery |
Confidential |
Confidential |
|
Primary Level |
223,287 |
39,116 |
|
Middle |
Confidential |
Confidential |
|
Secondary level |
167,559 |
95,241 |
|
Special |
24,160 |
8,159 |
|
Total Maintained |
422,302 |
144,334 |
|
Non-Maintained Mainstream |
49,169 |
27,303 |
|
Total |
471,471 |
171,637 |
Source: Explore Education Statistics for the UK (School Workforce in England, 2024).
Primary Level:
- 223,287 female teachers (approximately 85% of the primary teaching workforce).
- 39,116 male teachers (about 15% of the primary teaching workforce).
Secondary Level:
- 167,559 female teachers (approximately 64% of the secondary teaching workforce).
- 95,241 male teachers (about 36% of the secondary teaching workforce).
Special Education:
- 24,160 female teachers (about 75% of the special education teaching workforce).
- 8,159 male teachers (about 25% of the special education teaching workforce).
